Vine, Instagram and fake digital trends
876 words | ~4 min
Three recent posts from the Marketing Land blog tell a morality tale on the perils of believing your own hype when it comes to digital trends.
On June 8th, the blog published an article titled 'Vine passes Instagram in total Twitter shares'. It hinged on this chart, from Topsy Analytics, apparently showing volumes of tweets posted to Twitter containing links to Instagram and Vine:
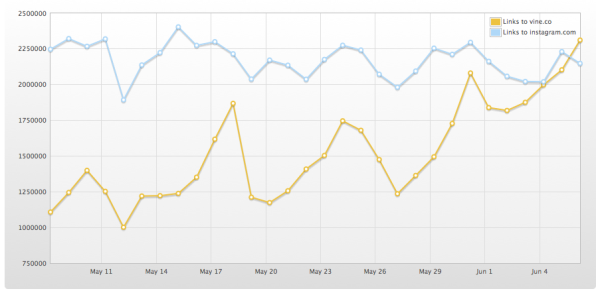
So far, so interesting. Plucky little Vine overtaking its giant competitor.
Then less than three weeks later, another article: 'A Week After Instagram’s Video Launch, Vine Sharing Tanks On Twitter'. And with it, an update of the same chart:
Taken together, these two would suggest that Instagram and Vine were locked in a head-to-head struggle, with some dramatic reversals of fortune. Very exciting stuff for those who love a good trend. First, Vine is the underdog that races into the lead. Next, Instagram knocks it back by introducing video sharing. A rollercoaster of trend-based action.
But hang on. Because this should give us all reason to raise an eyebrow. A quick bit of Googling tells us that Instagram has 130 million active users, while Vine has only 13 million. Are we really to believe that the two services are neck-and-neck?
To Topsy's credit, they saw the story brewing and posted a response. They explained:
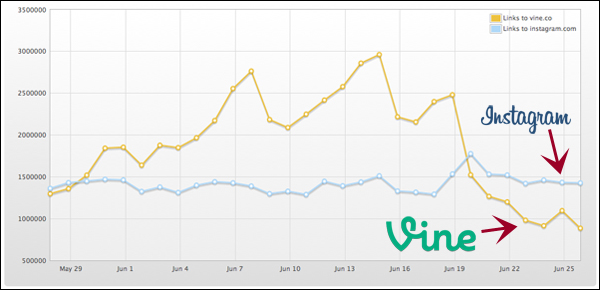
The free Topsy service generates trend charts using a sample of the most influential people and tweets. This allows users to see emerging trends among influencers in real time... while the free service gives you a high-level snapshot of the momentum and direction of the social conversation around a topic or domain, Topsy Pro gives you the complete and unfiltered picture that accounts for every single tweet. Because influencers tend to move faster than the general social media population to try the newest things—which is part of what makes them influential—new trends or changes in the direction of trends can appear amplified in charts generated by our free service.And they published this chart, showing the real ratio of Instagram to Vine shares: 
In short, Vine has grown a lot recently, and has suffered a recent dip. But the whole story is based on nonsense.
In fairness, Marketing Land also published a clarifying post - though I don't think they give due prominence to the 'postscript' on the two original posts, both of which are still up, which points out that their analysis was wrong. Ideally they should take those two posts down and replace them with a retraction.
Topsy, on the other hand, are to be congratulated for handling this well - even though they should probably have a much bigger warning sign on their free product.
But mainly, this is a story about the dangers of unchecked trends. This sort of story can be hugely influential. If you're a digital publisher and you only read the first one, you might decide to shift your efforts from Instagram to Vine; or from Vine to Instagram, if you read the second. As it is, you'd be crazy to act on the basis of either piece of 'information'. But you wouldn't necessarily know that.
Marketers are bombarded with trends by an increasing number of digital marketing and analytics companies. If the marketers don't know the right questions to ask, they are vulnerability to plausibility bias: the tendency to believe that stories constitute evidence, just because they contain numbers and are told by people who sound like they know what they're talking about.
So if you're a marketer, and someone shows you a trend, here are three questions you should always ask:
- How are these metrics calculated? Always ask this for metrics that appear to be something other than simple counting - especially scores like 'sentiment', 'influence' or 'customer value'.
- Is the data from a single source? Always ask this if someone is asking you to make a comparison. If I show you data on smartphone penetration in the UK vs Botswana, how do you know the data's been collected using the same method and represents a fair comparison?
- Is the data sampled? Always ask this. Just always. And then find out how it's sampled and how you can be sure the sample is representative. In the case of the data above, it definitely wasn't.
And if you don't get sensible answers to those three, be very careful indeed.
# Alex Steer (29/06/2013)