Predicting the future of advertising: Do the futurists beat the pundits?
1569 words | ~8 min
The Wharton Future of Advertising Program at the University of Pennsylvania has begun a study to explore what the advertising industry might look like in 2020. According to its website (my emphasis):
Over 150 thought leaders, innovators, and visionaries from a breadth of disciplines and around the world helped co-create this concept, and Advertising 2020 reflects a mosaic of their insights and ideas. Among those who are in a position to actually make changes seek to understand what is possible, not merely what is inevitable.
I wondered: how diverse a set of predictions did these over 150 industry leaders actually make? And do these long-term forecasts offer more variety than short-term ones?
So, in the spirit of Philip Tetlock, I devised a quick and dirty test.
The data
I used two data sources:
- The raw text of all the 2020 predictions submitted to the Wharton programme - a total of 39,405 words.
- The raw text of the 2013 predictions I found at the end of 2012 and recorded in this post - a total of 33,041 words.
These are quite different groups. The first is a carefully chosen group of experts selected for breadth. The second is a semi-randomly chosen group of industry pundits whose blogs I happened to be able to find through an hour or two of Googling.
The hypothesis
I expected the experts to outperform my random pundits for diversity of topics covered. They had been selected for this, after all - and they were being asked to forecast the industry over an eight-year span (to 2020) instead of a one-year span (to end of 2013).
I planned to measure this by a fairly crude measure - the frequency distribution of words (excluding very common words) used in the predictions. In theory, the more diverse the conversation, the more variety there should be in the terms used.
My method (and why it's a bit dodgy)
I'm normally sceptical about the value of word frequency studies, for reasons that this post on the Lousy Linguist blog makes clear. However, there's some value to them for looking at how tightly clustered the topics of discussion in a corpus of texts are. It doesn't tell you much about opinions, differing points of view, etc. But it does tell you whether people are covering the same ground - which as a first pass at an overview of predictions, is pretty important.
It's by no means perfect and there are much better ways of doing it. But it's quick and gives us a starting point. I'd love to see people improve on it.
I took the text of both sets of predictions, and ran them through some basic frequency analysis. I removed punctuation (non-alphanumerics except hyphens), harmonised to lowercase, then excluded numeric-only strings (sorry, but it was creating a lot of low-level noise of little analytical value). Then I excluded items from the Oxford English Corpus's list of the most common words in English: so-called 'stopwords' like 'be', 'and', 'the', etc, which account for around 50% of words in most well-balanced collections ('corpora') of English prose.
I scored the results by frequency to give a list of distinct words (excluding common stopwords) used in each set of predictions:
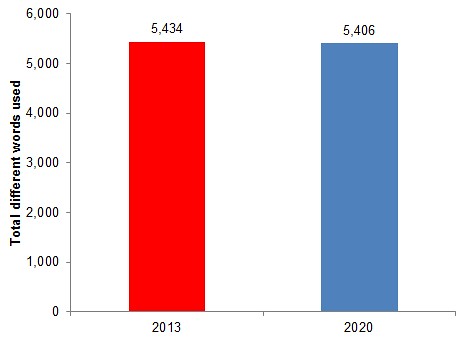
This raises an initial red flag. The number of different words used in the 2030 predictions is barely different from (and a tiny bit lower than) those used in my semi-random selection of 2013 predictions.
How similar were the 2013 and 2020 predictions?
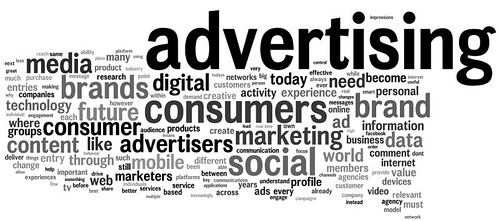
I started by looking at the top 20 terms used in the 2013 and 2020 predictions. I've marked in bold the ones that appear in both top 20s:
| 2013 | 2020 | |
| 1 | marketing | advertising |
| 2 | brands | consumers |
| 3 | content | social |
| 4 | social | brand |
| 5 | data | brands |
| 6 | mobile | media |
| 7 | consumers | marketing |
| 8 | media | consumer |
| 9 | brand | advertisers |
| 10 | marketers | future |
| 11 | become | content |
| 12 | companies | digital |
| 13 | business | data |
| 14 | online | mobile |
| 15 | big | need |
| 16 | users | ad |
| 17 | services | like |
| 18 | trend | world |
| 19 | been | today |
| 20 | digital | technology |
There's a 50% overlap. Half of the key terms my pundits used to describe next year's advertising industry were also being used by the Wharton experts to talk about the industry in 2020.
This would be fine if the overlapping words were very long-standing parts of the marketing lexicon. But (by my reading) they are disproportionately the marketing buzzwords of 2012: data, mobile, social, content, etc.
In fact, it's surprising how some very important long-standing industry terms seem to be under-represented in the 2020 predictions. 'Agencies' is in 56th place, 'messages' in 91st place. (Though by comparison, 'agencies' is in 318th place in the 2013 predictions, and 'messages' in 391st! Which suggests 2013 could be a lean year for traditional agency and comms models...)
How varied were the words used in each set of predictions?
We've seen that the 2013 and 2020 predictions cover very similar ground at first glance. But we'd expect the 2020 predictions to have a much longer tail - including more varied discussion with a further out view.
This is basic forecasting logic, by the way. The further out in time you get, the wider the cone of uncertainty and the greater the range of possible futures stretching away from the present. We'd expect longer-term forecasts or scenarios to be more varied.
But this isn't what happens. The chart below is a cumulative frequency count of words in the two sets of predictions. It shows the proportion of the total word count (y-axis) that is made up of the most frequently-used words (x-axis).
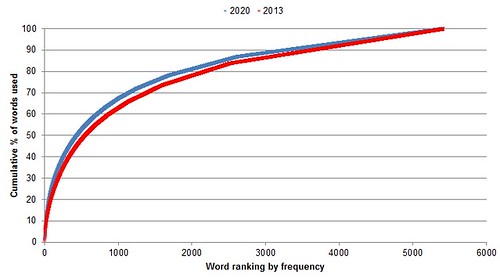
Both sets of predictions follow a classic power law distribution, even once you've removed the common 'stopwords', as we have here. A handful of extremely common 'marketing-speak' words dominate the discussion. This is a measure of the variety of the language used in the predictions.
But what's most interesting is that the 2020 predictions are less varied than the 2013 ones. Both are very low on variety - 10% of the text (excluding stopwords) consists of 23 marketing keywords in the 2013 predictions. But in the 2020 predictions, 10% of the text is accounted for by just 16 words - an average of two words in every sentence from the table above.
| 2013 | 2020 | |
| Number of marketing terms making up 10% of total prediction text (excluding stopwords) | 23 | 16 |
So what?
Word frequency analysis is a pretty crude measure. But from this initial look, I don't see any reason to believe that the broad panel of experts gave more varied or more forward-looking forecasts than the pundits doing their end-of-year run-down. They seem just as prone to the kind of buzzword bingo that we rather enjoy in the New Year predictions race.
Something more than my dodgy word frequency analysis is needed. But for now it seems that there may be too much consensus about what the future of advertising looks like. And that kind of consensus, backed up by heavy spending, has all the makings of a bubble.
# Alex Steer (03/04/2013)