Alex Steer

Better communication through data / about / archive

Why the pound is down: a crash course in machine learning

1203 words | ~6 min

You might have seen in today's news that the trading value of the pound fell by 6% overnight, apparently triggered by automated currency trading algorithms. Here's how that looked on a chart of sterling's value against the dollar:
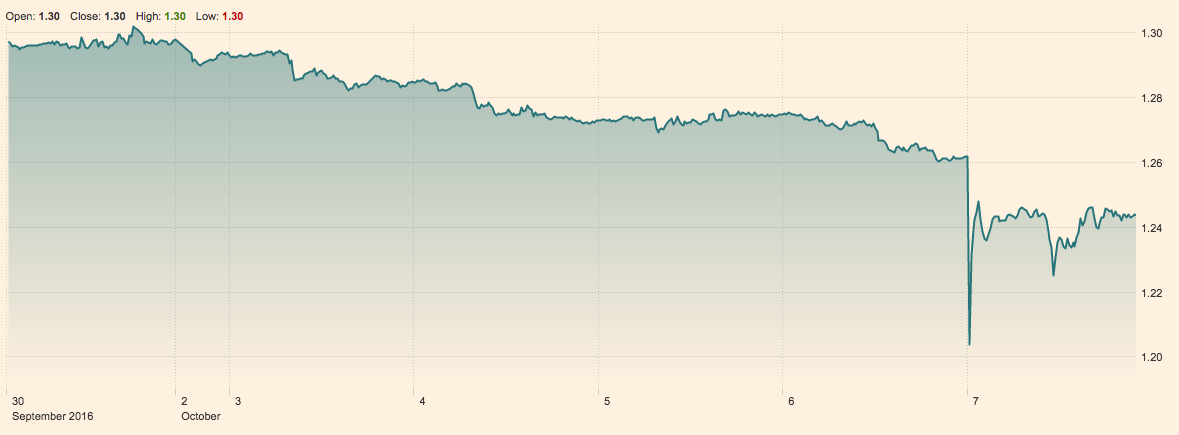
Sterling vs Dollar - late Sept to early Oct 2016 (Source: FT.com)

It's a fascinating read - we live in a world where decisions made by computers without any human intervention can have this sort of impact. And since 'machine learning' of this kind is a hot topic in marketing right now, and powers a lot of programmatic buying, today's news is a good excuse to think about the basics of how machines learn.

So, here's a a quick guide to how machine learning works, and why the pound in your pocket is worth a bit less than it was when you went to bed (thanks, algorithms).

Anomaly detection: expecting the unexpected

Machine learning is a branch of computer science and statistics, that looks for patterns in data and makes decisions based on what it finds. In financial trading, and in media buying, we need to find abnormalities quickly: a stock that is about to jump in price, a level of sharing around a social post that means it is going viral, or a level of traffic to your ecommerce portal that means you need to start adding more computing power to stop it crashing.

For example, these are Google searches for Volkswagen in the UK over the past five years. See if you can spot when the emission scandal happened.

Google search trend for Volkswagen, UK, 2011-16

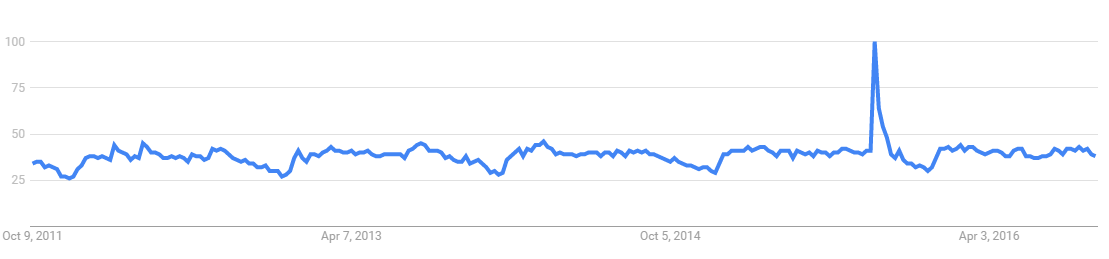
If you wanted to monitor this automatically, you'd use an anomaly detection algorithm. If you've ever used a TV attribution tool, you've seen anomaly detection at work, picking up the jumps in site traffic that are attributable to TV spots.

Anomaly detectors are used to set triggers - rules that say things like If the value of a currency falls by X amount in Y minutes, we think this is abnormal, so start selling it. This is what seems to have happened overnight to the pound. One over-sensitive algorithm starts selling sterling, which drives down its value further, so other slightly less sensitive algorithms notice and start selling, which drives down the price further, and so on...

Conditional probability: playing the odds

Most decision-making, especially at speed, isn't based on complete certainty. Algorithms need to be able to make decisions based on a level of confidence rather than total knowledge.

For example, is this a duck or a rabbit?

Duck-rabbit illusion - 1

At this point you might say 'I don't know' - i.e. you assign 50:50 odds.

How about now?

Duck-rabbit illusion - 2

You take in new information to make a decision - if it quacks out of that end, it's a duck. (Probably.)

This is conditional probability - updating your confidence based on a new information in context. 'This is either a rabbit or a duck', becomes 'this is a duck, given that it quacks'. We use conditional probability in digital attribution ('what is the likelihood of converting if you have seen this ad, vs if you haven't?') and we use it in audience targeting for programmatic buying: given that I've seen you on a whole load of wedding planning sites, what is the likelihood that you're planning a wedding?

Again, conditional probability can go wrong if we're too strict or not strict enough with our conditions. If I decide you're planning a wedding because I've seen you on one vaguely wedding-related site, I'm probably going to be wrong a lot of the time (known as a high false positive match rate). If I insist that I have to see you on 100 wedding planning sites before I target you as a wedding planner, I'm going to miss lots of people who really are planning weddings (a low true positive match rate).

Currency trading algorithms use conditional probability: given that the value of the pound is down X% in Y minutes, how likely is it that the pound is going to fall even lower? An over-sensitive algorithm, with too high a false positive rate, can start selling the pound when there's nothing to worry about.

Inference: how machines learn, and how we use brands

Anomaly detection and conditional probability are used together to help machines learn and classify, known as inference because computers are inferring information from data.

For example, a few years ago Google trained an algorithm to recognise whether YouTube videos contained cats. It did this by analysing the frame-by-frame image data from thousands of videos that did contain cats.

Google machine learning - cats

But it also trained the algorithm on lots of videos that weren't cats. That's because the algorithm is a classifier, designed to assign items to different categories. The Google classifier was designed to answer the question: does this image data look more like the videos of cats I've seen, or more like the videos of not-cats?

Good inference requires these training sets of data so that. A badly-trained classifier will assign too many things to the category it knows best, assuming that everything with a big face and whiskers is a cat.

Cat and seal

We use classifiers in audience targeting and programmatic buying, to assign online users to target audience groups. For example, in Turbine (the Xaxis data platform) each user profile might have thousands of different data points attached to it. A classifier will look at all of these and, based on what it's seen before, make a decision about whether a user is old or young, rich or poor, male or female... So inference and classification are vital for turning all those data points into audiences that we can select and target.

But we are also classifiers ourselves - our brains are lazy and designed to make decisions at speed. So when we go into the supermarket we look for cues that the thing we're picking up is our normal trusted brand of butter, bathroom cleaner or washing-up liquid. Retailers like Aldi hijack our inbuilt classification mechanisms to prompt us to choose their own brands:

Named brands and Aldi equivalents

From metrics to models

There's so much data available to us now - as marketers, as well as stock traders - that we can't look at each data point individually before making decisions. We have to do get used to using techniques like anomaly detection, conditional probability and classification to guide us and show us what is probably the right thing to do, to optimise our media or our creative. Machine learning can help us do this faster and using larger volumes of data. At Maxus we call this moving from metrics to models and it's one of the things we can help clients do to be more effective in their marketing. As we've seen today on the currency market, though, it can be scary and it can have unexpected consequences if not done properly.

# Alex Steer (08/10/2016)


Facebook video metrics, and why platforms shouldn't mark their own homework

527 words | ~3 min

Originally posted on the Maxus blog

Facebook has revealed that for the last two years it has been overstating video completion rates, due to an error in the way it calculates views.

Because Facebook only counts as a 'view' any video consumption over three seconds, it has been applying the same logic to its video completion rate metric - so the metric tells us not how many people who started watching a video then finished it, as we would expect, but how many got past the first three seconds and then finished. It is estimate that their video conversion rates have been overstated by 60 to 80% for the last two years.

Facebook are now hurrying to amend the metric, which they are treating as a replacement, but which is in reality a bug fix.

The news is understandably shocking to advertisers and their agencies, many of whom have been investing heavily in video and using these metrics to monitor and justify spend.

But it is also sadly predictable - an inevitable consequence of the lack of auditability in the metrics produced by many media platforms, not just Facebook.

Facebook have not allowed independent tracking of video completion rates on their platform, meaning that the only way to get video completion data is from Facebook itself. They are not unique in this, and we see this 'metric monopoly' behaviour from many of the digital media platforms, usually citing reasons such as user experience or privacy. Rather than allow advertisers to conduct their own measurement, many platforms are now offering to provide advanced analytics to brands who buy with them, including digital attribution and cross-device tracking. The data and the algorithms that power this measurement remain firmly in the media owner's black box.

Today's news makes it clear how unacceptable an arrangement this is. At Maxus we talk about the importance of 'Open Video' - planning video investment across many channels and touchpoints, reflecting people's changing use of media and making the most of the vast and proliferating range of video types that exist today, from long-form how-tos and product demos to seconds-long bitesize experiences in the newsfeed. As video changes, it creates more opportunities for brands, far beyond the thirty-second spot.

But Open Video requires a commitment to open measurement. As advertisers and agencies we have to be able to gather a coherent, consistent picture of what people are seeing and how content is performing. We are investing significant effort in building the right measurement and technology stack to help clients plan, deliver, measure and optimise Open Video strategies, including advanced quality scoring, attribution and modelling that lets us see how exposure in one channel compares to another in terms of quality, completeness and effectiveness.

Media platforms create amazing new possibilities and are important partners to advertisers and agencies in innovation and delivery. But they should not be allowed to mark their own homework. Measurement and attribution should always be independent of media delivery, available to agencies and auditable by clients. Any other arrangement is a compromise - and, as we've seen this week, a risk.

# Alex Steer (24/09/2016)


YouTube vs TV: where should advertisers stand in the 'battle of the boxes'?

1167 words | ~6 min

Tom Dunn and I wrote this on Brand Republic this week. Reposting...

It’s been an extraordinary couple of weeks on planet video. The TV industry body, Thinkbox, and Google’s YouTube have been engaged in a full and frank exchange of views that, both are at pains to point out, is absolutely not a fight. The topic they are definitely-not-arguing about is a fundamental one: where advertisers should spend their video advertising budgets.

The totally-not-trouble began brewing back in October, with a punchy statement from Google’s UK & Ireland Managing Director, Eileen Naughton, making the case the advertisers should shift 24% of their TV budgets into YouTube, especially if they’re targeting 16-34 year olds.

Last week, Thinkbox came back swinging, calling the Google claim ‘ill-founded and irresponsible’. In the intervening months they have been analysing viewing and advertising data, to find that while YouTube made up 10.3% of 16-24 year-old’s video consumption (v.s TV’s 43.5%), it made up just 1.4% of their video advertising consumption (with TV coming in at a whopping 77.5%).

Within a few days, Google wheeled out their econometric big guns and shot back with an even bigger claim: making the case for advertiser that YouTube offers a 50% better return on investment than that of television, and that 5-25% of video budgets should be spent on YouTube.

Now, it’s definitely not a scrap, but it seems that marketers and agencies are stuck in the middle and in a Brexit kind of way, need to make up their minds where they stand. And worst of all, the kinds of spats that used to be conducted via general pronouncements about consumer trends and attitudes are now being tooled up with findings from data.

Or, should we say, “findings”. From “data”.

Thinkbox and YouTube have stood out in the industry over the years for their commitment to research and measurement. Yet, in the battle of the boxes it seems both have lost focus and the numbers used raise more questions than answers.

As the heads of effectiveness and futures at a media agency, we both spend a lot of our time trying to find the balance between what’s working today and what’s changing tomorrow. This conversation about the impact of video channels matters. Because of the scale of the change we are already seeing in media consumption, and the greater scale of changes to come. Is the leapfrogging of linear TV by online video channels among the under-25s a temporary behaviour or a deeper generational shift? Will the box in the living room lose its next generation of viewers permanently, or will it welcome them back with open arms as a large generation, now house-sharing (or overstaying their welcome with their parents) find themselves with living rooms (and remote controls) of their own.

Either way, the world in which video advertising lives is changing. This stuff matters to all of us who use video to tell stories, make connections and grow our brands. That’s why it’s good to see media owners and industry bodies taking it seriously – but also why the use of data as weaponry has left something to be desired.

In the blue corner, ThinkBox. We’re puzzled by their argument more than by their numbers. They seem to be saying the because more advertising is consumed on TV, clients should advertise on TV more. Yet this comes across as circular logic – saying we should put our ads on TV because that’s where the ads are. If there is a 4:1 ratio of content consumption between TV and YouTube, but a 98:1 ratio of advertising consumption, surely that implies that YouTube has a lot more headroom? It’s fair to say that as consumers we still accept a far higher payload of advertising per piece of content on TV than we do on YouTube, but that’s as much to do with the vastly different buying models, available formats, and modes of consumption than ability of the platforms to deliver exposure.

In the red corner, YouTube, with is headline-grabbing claim of 50% higher ROI. The rationale for this is a study done with Data2Decisions, an econometrics and analytics consultancy. This is a good sign that there will be some robust measurement underpinning this, but more transparency is needed before this can be taken seriously.

The analysis uses a combination of market mix modelling (econometrics) to show the total contribution of TV vs. online video, and ecosystem modelling to dig down into the performance of different individual video channels. This is interesting stuff, and makes for good headlines, but it raises a lot of questions. We think there are three reasons to be cautious.

First, we don’t know what the period of research was, or how many brands, campaigns and categories were included. We don’t know what kind of campaigns they were. Brand-building vs. short-term sales-driving, for example. Like a clinical trial, we need to be confident that if we give you the same budgetary medicine, we know what the side effects might be.

Second, we’ve only seen the headline figures (mainly about ROI). This would be a misguided basis to start shifting huge chunks of budget around.

For example, if we spend £1 million on TV and drive £1.2 million in sales, we have an ROI of £1.20. If we spend £10,000 on YouTube and drive £18,000 of sales, we have an ROI of £1.80. This is 50% higher than TV, but is also delivering far less money. The research headlines don’t tell you what would happen to the ROI if you put more money into YouTube. Would it stay at 50% better than TV or would it start to diminish?

Third, the headlines are only comparing TV and YouTube. To do this properly, we need to understand the relative impact of other video channels to. YouTube’s ROI might be higher than TV’s, but how does it compare to the rest of the online pack?

We welcome the industry taking cross-platform video measurement seriously. At Maxus we have an ‘Open Video’ philosophy to setting video investment strategy, and we are developing tools and technology to plan, measure and optimise across different video channels efficiently and effecitvely. We use market mix modelling and attribution to identify the impact of different video channels, and advanced tracking to make sure that we have a common approach to measuring things like viewability, brand safety and inventory quality across video channels.

That’s why we’re asking both YouTube and ThinkBox to put down their sharpened spreadsheets and to back up the headlines with evidence. It’s not a matter of suddenly shifting money from TV into YouTube, but of understanding what the right channel mix is for individual brands based on their needs, their priorities and their audiences.

Entertaining as the ringside seat has been, advertisers deserve a bit better. It’s time for a grown-up conversation about what’s working now, and what’s changing next.

# Alex Steer (27/04/2016)


Saying no to marketing tech's Project Fear

829 words | ~4 min

I wrote this for the Maxus blog - reposting here...

I got an email this morning whose subject line read: 'If you're just keeping up to date in marketing tech... You're not doing enough.'

I get similar emails every day, and so do our clients. They reflect the growing tendency of marketing technology companies to sound like people who are trying to sell you gym membership. Except that rather than muscle-bound personal trainers shouting about rock-hard abs, this assault on marketers' sanity and dignity comes via whitepapers, webinars and other content marketing channels.

In some ways this is nothing new. 'Fear, Uncertainty and Doubt' has been part of the IT salesperson's kit for a generation – and is still, famously, associated with technology giants like Microsoft and IBM as they slugged it out for dominance of the enterprise computing sector in the 1990s. But whereas old-school FUD was all about knocking the competition, the new school is all about knocking the client.

Those of us who work in digital, technology and analytics are subjected to a sustained Project Fear campaign from many technology providers. (Before you write in and complain, there are notable exceptions, of course – but sadly they're notable because they're exceptions.) It's as if, now that marketers are huge spenders in data and tech, many vendors are determined to keep them feeling confused and vulnerable. Despite all the evidence to the contrary, the industry is behaving as if it's a seller's market. The kind of advertising hard-sell that went out of favour in the mid 1960s seems to be alive and well here.

If we as marketers still talked to our consumers the way many tech and data companies talk to us, those consumers would long since have abandoned our brands.

The narrative of Project Fear is consistent: every client who has bought our product has transformed their relationship with customers in ways you haven't thought of yet. You're being left behind. Your customers will abandon you and tough guys will kick sand in your face. Without this gym membership – sorry, enterprise software license – you'll be laughed out of the bar by your peers.

This message is broadcast through social media and the trade press every day. It continues to have power because there are so many topics it can cover. If as a marketer you feel like you've mastered web analytics or ad serving, there's always digital attribution, cross-device tracking or containerisation (don't ask) waiting in the wings. And just behind them are the looming bogeymen of machine learning and the internet of things...

To understand Project Fear – to get a handle on how some marketing tech firms feel so able to harass their customers in this way – you need to follow the money. Despite appearances, this is not a seller's market. There is colossal over-supply in marketing tech and the reasons are structural and come down to one point:

You, the marketer, are not the customer.

Now, again, there are exceptions. Large public businesses like Google, Oracle or Adobe depend for their success on satisfied marketers (in part, at least). But for every one of them there are a thousand marketing tech startups who depend on venture capital funding. VC money works in an entirely different way from marketing revenue. It comes in huge, infrequent waves rather than a steady trickle. It is given, or not, depending on funders' perceptions that a business has fairly rapid growth potential. When your business model is to attract the next big round of VC funding, you need lots of marketers to come on board fast. Marketing spend in this case isn't the big fish – it's bait.

When we understand that, Project Fear makes sense – and the need for change becomes apparent.

As marketers and as the agencies that work with them, we need to start demanding customer service and customer satisfaction. The best technology companies, whose incentives are aligned with our own, will support us in this because they profit when we profit. The rest need to understand that we will not maintain the pattern of scattered, reactive hoarding of technology and data assets that has characterised the last half-decade of marketing analytics and tech.

As an agency we work with clients to help them define their marketing technology, data and measurement strategies. In almost every case we find that there are more tools, more capability and more smart thinking already in place than the business realises. Very often, it's not a case of buying a shiny and intimidating new capability, but of making existing ones work harder and work together. Most digital business transformation happens with software, not because of software.

Saying no to Project Fear means saying yes to a more considered, design-led approach to crafting your technology, effectiveness and data ecosystem. It means embracing the subtler arts of data planning and technology plumbing. Above all it means acknowledging that change comes through teams and partnerships, not bells and whistles.

# Alex Steer (01/04/2016)


The dangers of data dependency

115 words | ~1 min

AdAge contains an article about a 10,000-person advertising research study with one of the least surprising findings imaginable:

The study, which the companies said involved 189 different ad scenarios, found that "viewability is highly related to ad effectiveness"

No, you did not misread that. It took a study of 10,000 people to establish that ads are more effective when you see them.

And in fact, this wasn't really an effectiveness study in any meaningful sense - it was an ad recall study.

So in short, the finding is: You're more likely to remember ads that you've seen than ads that you haven't.

There is such as thing as being too data-driven.

# Alex Steer (12/02/2016)


Buzz and effectiveness

101 words | ~1 min

It's Superbowl day today, so if you work in advertising, expect your social feeds to be full of analysis of which brands 'won' based on online buzz around their ads.

All this is good and interesting, and gets what we do in the spotlight. But don't mistake it for effectiveness.

TV brand advertising works hard - but over weeks, months and years, not minutes. Being famous for fifteen minutes is a good start, but just that - a start, not the endgame.

Social buzz is to effectiveness what journalism is, famously, to history - lively, interesting, but just the first draft.

# Alex Steer (07/02/2016)


Ad-blocking comes from a measurement problem

479 words | ~2 min

The release of iOS 9, which enables ad-blocking apps on iPhones, has caused no end of controversy.

One the one hand, advertising is the sponsor of lots of things on the internet that are free and wouldn't be otherwise. On the other people find online ads sufficiently annoying that they want to block them - to an extend that far exceeds ad avoidance in any other medium.

And annoyingly, both sides are right, which suggests something is broken in the online advertising market.

In fact, it's very clear what this is. Online advertising still suffers from an enormous measurement problem that has led to the proliferation of bad ads.

A vast amount of online ads are still measured on a 'last-click' basis. They are deemed effective only if they are the last thing that drags someone over the threshold to your website, app or online store.

This is, obviously, a horribly flawed way of thinking about how advertising works. To take an offline analogy, this is like saying that if someone sees a big TV ad for a new brand of baked beans; then a great series of press ads; then sponsorship at their favourite sports game; then a PR story about how the beans are sustainably farmed; then goes to the supermarket where there are shelf wobblers pointing him to the brand... then the shelf wobblers should take all the credit if he buys a tin.

This is a problem that has been solved many times over - by marketing mix modelling, and more recently by more detailed digital attribution methods that can see entire customer journeys to purchase, and calculate how important each advertising exposure along that journey was to the final outcome. We've run dozens of mix modelling and attribution studies for clients, and in almost every case, we've found two things:

  1. Clicks barely matter. Seeing ads is what makes people more likely to purchase.
  2. All the advertising people see matters - not just what they see last.

This is not surprising. Yet we're still buying adverts based on a cost-per-click basis, and attributing sales based on clickthrough, because it's easier to keep doing that than to change how we measure and report. Since clicking is an unnatural behaviour, we flood the web with ads in order to get a few clicks, and we reward shrill, intrusive, noisy advertising that leads to clicking, a behaviour that (with the exception of paid search) has almost nothing to do with how advertising works.

No wonder people want to switch off the advertising hose. By measuring properly, understanding which exposures to advertising are effective are worth paying for, we might avoid crashing our own market.

# Alex Steer (19/09/2015)


The M&C Saatchi advertising equation

233 words | ~1 min

Good to see M&C Saatchi's mad PR equation is back in the adland headlines:

After long hours looking at data from Nielsen and Unilever, the Saatchi Institute was able to map the correlation between the ability of a brand to maximise differentiation and minimise deviation. The equation Saatchi proclaimed as "the answer" back in June is the formula for the curve created when the Unilever data was plotted on a graph.

Well, that's more than we got a few months back when it was first shown (with no explanation). It's unnecessarily obscure for a curve equation, though. It looks like a power law equation to me. On the plus side, it's doing a great job of winding people up, a classic Saatchi move.

If I had to guess, I'd say it maybe describes the factors that condition the extent of a brand's ability to steal market share (which normally operates on a power law basis), presumably by balancing differentiation with the minimisation of loss of sales due to short-term factors, like competitor price-cutting. If so, that's a perfectly good basis on which to think about your advertising.

As and when some detail about it actually gets published, I'll be all over it and looking to test it on data from other brands.

# Alex Steer (26/08/2015)


Lift Points: A currency for effective impressions

504 words | ~3 min

This is a quick follow-up to an equally quick Twitter conversation with Faris Yakob about his interesting piece in the Guardian on the currency of online impressions. The piece's main argument is that the assumption that the impression is the currency of attention is faulty:

In order to buy and sell something, we needed a currency. We settled on the impression: one person being exposed to something once. Attention is a complex and analogue aspect of consciousness – its most directed form – which makes it a small part of the most complex system in the known universe. The complex, fundamentally analogue, nature of attention, which has many different facets, is converted into the simple, inherently binary, impression.

The piece is both mostly fair and a bit unfair. There are better ways of measuring attention; they are granular and specific to specific ad exposures; but they're not yet a properly tradable currency for online media.

So what are they? And what should the currency for attention be?

They don't really have a name yet, but they do exist, we're working with them, and my shorthand for them would be Lift Points.

Here's how it works. Using log-level ad-server or site analytics data (the same thing that gives us impressions), it's possible to identify the number, order and nature of exposures an individual has had to online advertising during a time period. This is particularly true if you can deduplicate across devices, tie cookies/device IDs back to real people, and so on. So far, so obvious.

Using sufficiently large behavioural tracking + attitudinal research panels (e.g. Millward Brown's Ignite network), it's possible to tie these granular impressions to well-controlled brand tracking surveys.

Briefly, this means you can effectively regress the test-vs-control uplift in brand awareness/equity/whatever to specific patterns of exposure - creative, site, placement, order, recency, frequency, and so on. By treating this like an attribution model you can assign percentage points of brand uplift to specific factors in the advertising mix. This can be done at a very large scale, and very quickly - and you can use it to isolate the contribution of any factor and give its typical contribution to uplift. And those are Lift Points.

The most obvious - and most easily tradable - would be Awareness Lift Points - the average incremental points of brand awareness delivered by an ad / placement / etc per single exposure. Because ads that are unseen have no impact on awareness, like any good attribution it controls for viewability automatically.

Is it immediately tradable the way impressions are? No, but if used it would quickly build up a tradable market value the way that media owner ratecards or viewability scores do - based on the typical delivery of uplift per exposure. It's also challenging to the economics of the research industry as it means a vast number of very small and fast-turnaround post-exposure test-and-control surveys, but some providers are already moving in this direction.

# Alex Steer (11/08/2015)


From engines to engineering

220 words | ~1 min

Sometimes it's good to be reminded of what really good brand planning does: takes the latent potential of a brand and makes it into an asset, by connecting something obvious about the brand to something important in life.

Lexus have made fairly bland ads for years. They always tried to be about emotion but got clogged with distracting functional claims about the fuel pipelines, the energy efficiency, the power/weight ratio, or whatever. They ended up being forgettable ads about engines.

Their new work seems to have owned up to the fact that, as a business, they clearly get off on technical ingenuity rather than poetry. It's enabled a slight but powerful shift - from ads about engines, to ads about engineering.

It's a feat of subtle brand planning that's given them something that they want to talk about, that is worth listening to.

Rather than another ad about fuel injection, they've built a working hoverboard, and used that as the focus of a film about trying, failing, learning and succeeding. The internet is, rightly, passing it round like crazy, and it's really worth watching. (The craft of the film is also great.)

Well done to everyone involved. I hope it sells you some cars.

# Alex Steer (05/08/2015)